Inventory Dashboard
Overview
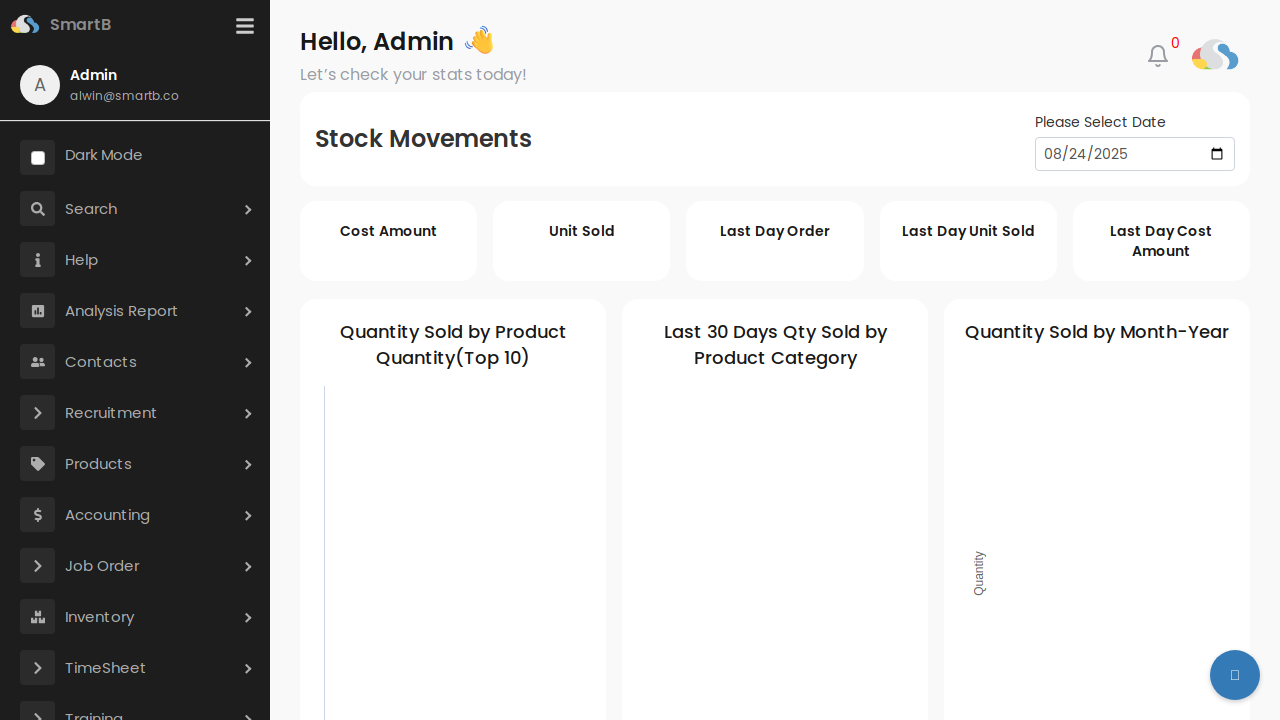
The Inventory Dashboard provides a comprehensive real-time view of your inventory metrics and movements. It serves as the central hub for monitoring stock levels, analyzing trends, and making informed inventory decisions.
Navigation
To access the Inventory Dashboard:
- From the main menu, click on Inventory in the left sidebar
- Select Dashboard from the submenu
- Or navigate directly via URL:
https://main.smartb.co/action?name=stock_board
Key Features
Date Selection
- Please Select Date - Use the date picker in the top-right corner to view historical data for any specific date
- Default view shows current date metrics
Stock Movements Section
The dashboard displays key inventory metrics in real-time:
- Cost Amount - Total value of inventory movements
- Unit Sold - Number of units sold during the selected period
- Last Day Order - Orders from the previous day
- Last Day Unit Sold - Units sold in the last 24 hours
- Last Day Cost Amount - Total cost value of yesterday's movements
Analytics Charts
1. Quantity Sold by Product Quantity (Top 10)
- Bar chart showing the top 10 products by quantity sold
- Helps identify best-selling products
- Updates based on selected date range
2. Last 30 Days Qty Sold by Product Category
- Visual breakdown of sales by product category
- 30-day rolling window for trend analysis
- Useful for category performance comparison
3. Quantity Sold by Month-Year
- Time series chart showing sales trends over months
- Helps identify seasonal patterns
- Year-over-year comparison capabilities
Common Use Cases
Daily Inventory Review
- Open the dashboard each morning
- Review "Last Day" metrics to understand yesterday's activity
- Check top-selling products to ensure adequate stock levels
- Monitor category performance trends
Stock Planning
- Analyze monthly quantity sold trends
- Identify seasonal patterns in the Month-Year chart
- Review top 10 products for reorder planning
- Use category breakdown to balance inventory mix
Performance Analysis
- Select specific dates to analyze historical performance
- Compare cost amounts vs units sold for margin analysis
- Track category performance over time
- Identify slow-moving inventory categories
Tips and Best Practices
- Set a Daily Review Routine - Check the dashboard at the same time each day for consistency
- Use Date Filters - Compare different time periods to identify trends
- Monitor Top Products - Ensure your best sellers never go out of stock
- Watch Category Trends - Adjust purchasing based on category performance
- Export Data - Use the data for detailed analysis in external tools
Related Functions
- Stock Balance - View current inventory levels
- Stock Movements - Detailed transaction history
- Reports - Generate detailed inventory reports
- Inventory Settings - Configure dashboard preferences
Troubleshooting
Dashboard Not Loading
- Check your internet connection
- Verify you have the necessary permissions
- Clear browser cache and cookies
- Contact system administrator if issues persist
Data Appears Incorrect
- Verify the selected date is correct
- Check if all transactions are properly posted
- Run stock balance update if needed
- Review recent stock movements for errors